1. Summary
The BioCreative II.5 tasks are 1) article classification (ACT), 2) interactor normalization (INT), and 3) interaction pair extraction (IPT). As the data covers highly variable sizes of true result sets and results will be reported as ranked hits, the AUC of interpolated Precision/Recall (iP/R) curves was chosen as the evaluation scheme for the BioCreative II.5 training and test sets. Here, we explain the background for the evaluation, the evaluation function, how the results must be formatted to pass (offline) evaluation and work with the official evaluation script, and, for the interested, how AUC iP/R-scores compare to other schemes including a discussion of problems with other common evaluation systems in respect to this challenge in more detail.
2. Background
The target of BioCreative (BC) II.5 is to evaluate the utility of machine-assisted annotation of protein-protein interaction (PPI) articles for both authors and database curators. At its basis, this process builds on three fundamental tasks: identifying relevant documents, extracting and retrieving database identifiers for interaction-relevant proteins, and finally matching the correct pairs for the interacting proteins. Therefore, BC II.5 covers three tasks:
- ACT, article classification task (i.e., binary classification if an article contains protein interaction descriptions);
- INT, interaction normalization task (i.e., unique UniProt accessions for interactor proteins described in an article); and
- IPT, interaction pair task; respectively (i.e., unique, binary, and undirected interaction pairs reported as UniProt accessions).
The result presentation of a semi-automated system should present users with the most relevant classifications first by utilizing relevance-ranked and confidence-scored hits for the article. This means that three factors govern the performance of the machine-generated results: (1) recall (R), i.e., the percentage of returned correct hits over all possible true hits; (2) precision (P), i.e., the percentage of correct hits over all returned hits; and (3) the rank and confidence of the correct results, i.e., the system performance at any given a rank. The evaluation score needs to be internally consistent on the classifications for each article, comparable between different systems, and, most importantly, generate evaluation scores that are relevant with respect to the above requirements.
3. Evaluation and Result Format
3.1. Calculation of the AUC of the iP/R curve
The AUC of the iP/R-curve evaluation will be applied to all three tasks. As additionally discussed below, the AUC A of the interpolated P/R function fpr is defined as follows:
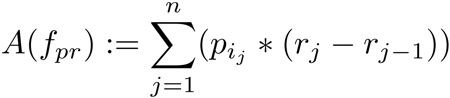
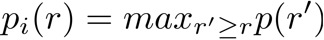
Where n is the total number of correct hits and pi is the highest interpolated precision for the correct hit j at rj, the recall at that hit. Interpolated precision pi is calculated for each recall r by taking the highest precision at r or any r’ > r.
In other words, for each jth ranked result, the current r is calculated, and for each distinct r value, the highest p (N.B., this is not the pi) at that r is retained. This results in a jigsaw like curve from high P at low R to the lowest P of the system at its highest R. The p at r then is interpolated if there is a higher p at any higher r, producing a step-like curve from the highest precision measured at the first correct hit in the ordered result down to the lowest precision at the highest recall when traversing the result list by rank.
3.2. Result Format
The result file format is simple plain text, where the article identifier to be used is the DOI (document object identifier) and the values must be singe-tab-separated, i.e., in the same format as the gold-standard annotations for the training set plus a rank and confidence value column. All results will have to be provided with a consecutive, ascending ranks for each hit reported, from [1..N], where N is the total number of hits. In addition, each hit will supply a confidence value in the range ]0..1]. Although confidence values are not used to calculate iP/R-curves, they will be used to evaluate (statistically) equal performing systems against each other by ordering the systems according to superior average confidence values. This is justified because confidence values could be used to compare hits internally and between systems, or as cutoff-values to limit the hits to be displayed for an annotated document. Therefore, results should ideally be ordered by discrete ranks and the confidence values should reflect this ordering, while hits with equal confidence values will have different ranks. I.e., for each reported hit, the rank r must and confidence c should have the properties:
{ri = ri-1 + 1} ∧ {ci ≤ ci-1}
with both values required to conform to:
{r1 = 1} ∧ {0.0 < ci ≤ 1.0}.
The evaluation script will first check the correct format and numeric ranges and will abort evaluation with the appropriate error message if any problems are encountered (and, therefore, result in a zero-performance evaluation score).
3.2.1 Interaction Normalization Task Results
INT results will be returned in four tab-separated columns, consisting of:
- DOI of the respective article.
- UniProt accession (and only the accession) of the interactor protein.
- Unique rank of that protein normalization in the range [1..N], where N is the total number of hits for that article.
- Confidence for that normalization in the range ]0..1], i.e., excluding zero-confidence.
3.2.2. Interaction Pair Task Results
There is no directionality in the results of pairs, i.e., each result has to be unique. Also, if a binary pair is listed twice with the two proteins simply swapping columns, the evaluation script will abort and result in an error leading to a zero-performance evaluation for that system. IPT results are to be returned by five tab-separated columns, consisting of:
- DOI of the respective article.
- UniProt accession (and only the accession) of protein partner A.
- UniProt accession (and only the accession) of protein partner B.
- Unique rank of that binary protein pair in the range [1..N], where N is the total number of hits for that article.
- Confidence for that pair in the range ]0..1], i.e., excluding zero-confidence.
3.2.3. Article Classification Task Results
Finally, the ACT results will be evaluated by joining the ranked list of positive classifications (1) with the inverted (highest to lowest rank) list of negative classifications (0). Therefore, a system can choose to produce various means of reporting results: only reporting positive results with the most likely interaction-containing articles ranked highest, only reporting negative results with the most unlikely articles ranked highest, or two separate rankings for the positive and negative results. ACT results have to be reported as four tab-separated columns:
- DOI of the respective article.
- Classification result (0 for negative, 1 for positive hits).
- Unique rank of that classification result in the range [1..Nc], where Nc is the total number of hits for negative (c=0) or positive (c=1) results.
- Confidence for that classification in the range ]0..1], i.e., excluding zero-confidence.
4. Discussion of Evaluation Methods
There are many evaluation schemes that have been published for Information Extraction, and even more for Information Retrieval. Most can be reduced to a basic set of schemes common to the filed. These schemes include:
- Reciprocal ranking (RR) schemes, e.g., MRR (mean RR), TRR (total RR) Q-score, etc..
- Precision- and recall-based evaluation of result sets, e.g., F-measure, or P@k (Precision at k [ranked] documents).
- The AUC (area under curve) of the ROC (receiver operator characteristics) curve, which is based on the above measures, but takes ranking and the specificity (as false-positive rate) of the system into account.
- The AUC of the P/R curve (precision/recall), also based on ranking, P, and R.
4.1. Reciprocal ranking (RR)
This measure is based on taking the reciprocal rank of a correct hit, i.e. 1/ri. The simplest RR example would be to take the (first) correct answer for a given question in a ranked list of answers; if the correct answer is ranked 4th, the score would be 0.25. To handle multiple correct answers, this score has been expanded to the TRR (total RR) by summing up the reciprocal ranks of the correct answers. E.g., assuming the 2nd and 4th answer had been correct; the score would be 0.5 + 0.25 = 0.75.
At a first look, this system fulfills all requirements: it reflects ranking, and it is intrinsically recall- and precision-based (the more correct documents are found and the higher (more precise) up the correct documents are found in the result list, the higher the TRR score.
In the setting of this challenge, although, an important reason why RR scores should not be used can be easily understood by example: The weights of the first few hits are disproportionally heavier than lower hits: having the first hit correct would result in a superior score (here: 1.0) than, e.g., having both the second and third (here: 0.833) hit correct, an obvious shortcoming with respect to this challenge, where several high-ranked, correct hits definitely outweigh a single first-place rank. One might imagine correcting this discrepancy by multiplying the TRR score with the total number of hits (in the above example 1.0 vs. 1.66) or the recall value. But this leads to another problematic situation, e.g. when the above system with the top hit in rank 1 would have a second hit for example at rank 50, it would still out-perform the second system, again a clearly wrong result.
4.2. Precision, Recall, and F-measure
The most common IE evaluation system is centered on F-measure, an evaluation score generated from combining precision and recall. This evaluation has an obvious shortcoming for this challenge: it does not take ranking of results into account. E.g., two systems reporting the same two correct and eight wrong hits for a document would produce the same F-scores, including precision and recall values, no matter the ranking of the results – an undesirable result.
To improve on this shortcoming, other graded, rank-based schemes such as P@k (Precision at a certain rank cutoff k) have been successfully used, e.g., for various TREC challenges. Yet, in regard to the BC II.5 challenge, variants of F-measure, precision, and recall scores using cutoffs have two shortcomings: The true set of correct results varies largely between each document (in the training set, the distribution is between one and 31 correct normalization/interaction-pair results per article); This would implicate, when using P@k scoring at any given cutoff, the scores would not be comparable from one article to the next (although, scores could be normalized with the maximum score for each article) and would require the use a constant cutoff value, which is not desired given the high variability in the number of true answers. Finally, this would lead to an evolution of the machine annotation systems on the chosen cutoff score instead of to more universal optimization function.
In conclusion, it would be desirable to combine the qualities of both approaches, discrete RRs and recall-/precision-based evaluation, to one combined system.
4.3. AUC of the ROC curve
The most widespread, combined scheme is the ROC curve. This scheme measures the sensitivity (= recall, or the true positive rate, Y-axis) against the inverse specificity (false positive rate, FPR, X-axis) over the ranking. Although this seems desirable with respect to the BC II.5 challenge, using the inverse specificity has an important implication (the FPR is defined as FP / (FP + TN), or the fraction of all negative examples that are misclassified as positive): In the setting of this challenge, the set of negative examples for the INT (normalization task) is huge – to be precise, all possible UniProt accessions for release 14.8: a total of 7,569,677 accessions, minus the true answers (on average, 4). This number grows even larger for the IPT (pair task), to approximately (7.57e62 - 7.57e6), or 50 trillion possible pairs. Even when reducing this number to pairs of only the same species (which would be wrong, as there can be pairs between, e.g., human and mouse proteins) or any other reduction of the negative set, the number of negative examples for the IPT always will be significantly larger than the number of negatives for the INT. In other words, TN in the above formula will be huge, while FP necessarily will be tiny, therefore producing a curve that only has significant changes in ranges almost approaching zero.
The standard approach to overcome this problem, the FROC curve (Free ROC), instead takes the number of average bad examples generated by the system, i.e., by “un-normalizing” the abscissa. Yet, given the high variability in the distribution of correct answers in the training set, a possibly not equal distribution of negative examples in the test set, and the fact that this “free FPR” has no (probabilistic) interpretation, such an approach is not feasibly for the problem at hand. A detailed review and discussion of the disadvantages of using ROC curves for settings as they are found in this challenge can be reviewed in [Davis and Goadrich. The relationship between precision-recall and ROC curves. (2006)].
4.4. AUC of the interpolated P/R curve
The scheme used for the BioCreative II.5 evaluation also covers all needs for the evaluation: An iP/R curve measures the highest possible precision at each achievable recall given a ranked (i.e., ordered) set of results. For a more detailed mathematical explanation, see section “3.1. Calculation of the AUC of the iP/R curve”.
The justification for the interpolation step is that if somebody would examine results after any given point in the list down to the next correct hit, this person would experience that (interpolated) precision over the reviewed results.
4.5. Comparison by Example
A simple example of two equally sized result sets of ten hits on a document with 4 known correct answers will suffice. Assume that system
A) returns 2 correct hits at ranks 1 and 10, while
B) returns 2 correct hits at ranks: 2 and 3.
Given the TRR scheme, system A) scores 1.1, or possibly 2.2 if taking the recall into account, while system B) would score 0.833, or 1.66 with recall. In both cases, the result is worse for the latter system and clearly the wrong result.
Trying to evaluate this result with an F-measure, P@10, or any similar scheme gives equal results for both systems; although better than the TRR result, still not the desired result. Furthermore, taking any other cutoff value would always be in favor of a system over another not “optimized” one at the chosen cutoff – e.g., if you were to choose any cutoff in the range 3-9 for P@k evaluation, system B would have gained double performance over A, again a clearly wrong result given the results of the two systems.
Evaluating the results with the ROC curve, the only difference in the FPR would be from rank 3 to 9, where system A reports 1 and system B already has scored 2 TP hits. Also, there would be no difference in the FPR after the 10th hit, even if one or both systems would continue to report false hits or not. Accounting for the huge set of negative examples (7e6 UniProt accessions), the difference between the AUC of the ROC curves of the two systems would be nearly infinitesimally small (or, more precise, at around 1 / 7e6 × ¼, i.e., about one in 30 million (¼ is the difference in recall between the two systems at ranks 3 through 9)) in favor of system B. Although this is already better than the former two schemes, the difference will not be (statistically) significant and the performance gains nearly impossible to interpret.
Examining this result with the interpolated P/R curve results in the following numbers:
At recall 0.25: A) has precision 1.0, B) has precision 0.5.
At recall 0.5: A) has precision 0.2, B) has precision 0.66.
To calculate the AUC of the interpolated curve, only a single point is relevant for system (B), the precision of 0.666 at recall 0.5, while the first point gets discarded because of the nature of the interpolation function. For (A), there is a stepwise curve from precision 1.0 at 0.25 recall, to precision 0.2 at 0.5 recall. Both get a flat 0.0 precision for any higher recall values. This means, the AUC for (A) is 1.0 × 0.25 + 0.2 × (0.5 - 0.25) = 0.3, while (B) scores 0.5 × 0.666 = 0.333. This time, there is a slight, but significant advantage visible in the score of system (B) over the score of (A): 0.333 over 0.3.
Furthermore, AUC of iP/R curves-scoring makes the use of cutoff limits dispensable: If one system scores many correct hits in high ranks, while another system scores the same or even more hits at significantly lower ranks, the precision penalty will still make it inferior to the former, i.e., reporting thousands of hits to possibly cover the complete recall range will never make a system superior to a system with only a few results, lesser overall recall, but higher precision in those few hits. On the other hand, reporting thousands of hits with high precision in the top ranks will produce nearly equal performance scores to a system with less hits but equally high precision top hits: Not reporting thousands of hits does not penalize a system (for having lower recall) and the performance inequality can be shown to be statistically insignificant (i.e., it can be shown that both systems perform equally well).